NZ Data Shows Up to 20% Higher Mortality for Males that Declines After Each Shot. How Can There be Such a Large Dose Dependency if the Shot is Safe?
By STEVE KIRSCH
We’ve always known that the Pfizer COVID vaccine kills disproportionately more males than females. Thanks to Barry Young, we can now confirm this effect in the NZ data.
Executive summary
I’ve known for a long time that the Pfizer COVID vaccine kills disproportionately more males than females. Females are disproportionately injured, but males disproportionately die.
This post covers two different effects: 1) an effect whereby males die at a higher rate than females for early doses and 2) an effect whereby people die at an accelerated rate after getting the COVID vaccine. The first effect is relatively small compared to the second effect.
Effect #1: A gender analysis of the New Zealand data shows an alarmingly higher rate of mortality of males within 120 days after the first two shots compared to after 120 days in the same cohort. The effect diminishes after the 3rd shot and is gone by the time the 4th shot comes around. The difference is statistically significant. If the vaccine is safe, the mortality after a shot should NOT be dependent on the dose number!
Effect #2: I’ll show you that when deaths are DECLINING in New Zealand, if you got one of those COVID shots, your death rate INCREASES over time. You are basically increasing your chances of dying with additional shots, which is the opposite of what they told you.
Methods for doing gender mortality analysis (Effect #1)
Since gender information wasn’t provided in the data, I used genderize.io to determine the statistical likelihood of each person who died being male or female. I verified that if you took every single death, that the male:female ratio was very close to the overall New Zealand male:female death ratio of 1.05 which affirms the accuracy of the genderize.io data.
The fact that the overall m:f death ratio didn’t move a lot doesn’t mean the vaccine is safe. It just means that the male:female disparity is just affecting younger cohorts and earlier shot numbers so the GENDER disparity effect is relatively small in comparison to other effects. But the fact it is there is just more proof the vaccines are unsafe.
I didn’t have the names of the people who were living and took the shot, so I couldn’t compute the ratio of males to females who received the shot.
So in the analysis below I will only be able to look at longitudinal effects, i.e., the difference in gender-specific mortality over time once they got a particular shot number. The gender ratio is fixed at the time of the dose and does not change over time (modulo the small fraction of people who die).
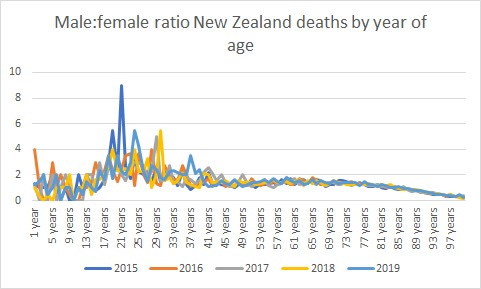
I chose an age range of 40 to 77 to give me a wide range of ages (so I collect the most information) in a range where the male:female death ratio is very stable in New Zealand.
Statistics used in the results below
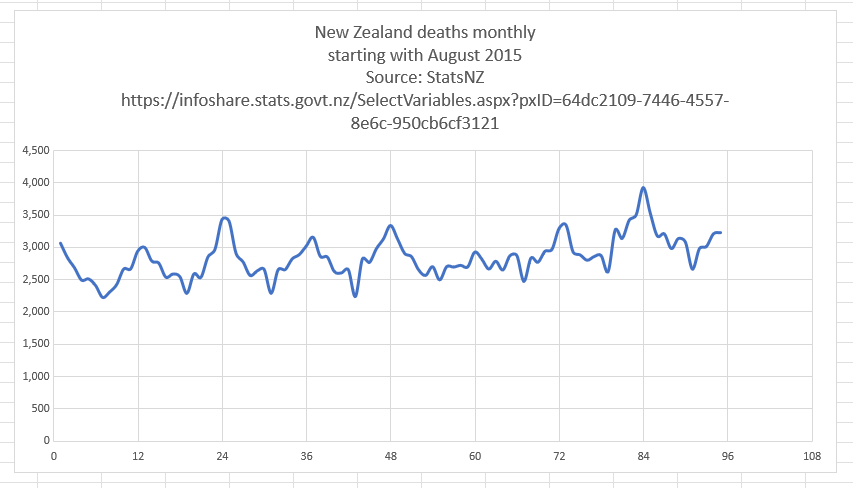
Gender results: Males died much faster than females. Earlier shots had the biggest effect.
For dose 1, males were far more likely to die than females in the first 120 days post-shot:

But if you look beyond 120 days, the rate of males:females dying goes from 1.75 to 1.46 which is a stunning drop.

The same effect happens in the first 120 days after Dose 2, but it is slightly smaller:


Now look at what happens to Dose 3 and 4 using the exact same longitudinal observation. Note that these doses are 6 months apart and shot 3 is given when there is a death peak and shot 4 is given when there is a death trough in New Zealand.
For Dose 3, the ratio drops from 1.36 to 1.31. So the effect is there, but it is smaller on these shots.


With Dose 4, we see that the gender effect is now gone. This shot is given 6 months after Dose 3 when background deaths are at a trough. So irrespective of background conditions, we see a diminishing gender effect… it’s now gone.


Statistical significance
For the Shot 1 data, comparing first 120 days vs. past 120 days, we get:
Fisher Parameters= 386 2435 221 1662
One-sided p-value= 0.027
Two-sided p-value=0.05
Odds ratio= 1.19
95% Confidence Interval(low=0.9958372077504843, high=1.4295034063306808)
There are other measures with CI’s that are both >1.
We’d love to have the full dataset from Health New Zealand and this would reduce the confidence intervals, but we can clearly see a huge problem with the data we have (p=.05).
Notes
- Genderize gives a probability which is why the death numbers are not integers.
- I only looked at 45-70 year olds as that’s the flat bit of the curve so wouldn’t be affected as much by shifts in the distribution of ages among the cohort.
- We can’t know the number of extra deaths from this analysis – only the number of extra male deaths.
- If females die more after multiple doses this would also give the appearance of decreasing male bias with increasing doses.
- Even if the absolute numbers are small earlier, overall, the larger concern regarding deaths after vaccination is what happens in later periods and ongoing. See my subtack on the definitive time-series cohort analysis (Dec 19).
Effect #2: Increase in numbers of deaths within the first 180 days in periods where deaths are declining
Another telltale sign of a problem is the number of deaths in days 20 to 100 and 100 to 180 after a shot. Let’s focus on shots 1 and 3 because both are given in months when death rates peak in New Zealand. So if the vaccine is safe, we should expect that the number of deaths in the first 80 days should be greater than then the number of deaths in the next 180 days because death rates are declining. The vaccine would have to be very powerful to overcome that. And we see it does!
Here are the numbers for days 20 to 100 and 100 to 180 respectively:
Shot 1: 1040 1147 (avg age 75 in both cases)
Shot 3: 2419 3154 (avg age is 82 in both cases since older people opted for more shots)
Note that I start on Day 20 to avoid the temporal healthy vaccinee effect which depresses counts in the first 3 weeks (people who are projected to die within a few days don’t get vaccinated).
Silence from Health New Zealand
Both of these results above (gender disparity) and death rates increasing when background deaths are decreasing create huge cause for concern.
Health New Zealand is ignoring the safety data and they refuse to allow their epidemiologists to explain or replicate these results. They even refuse to say why they refuse to be held accountable to explain their own data.
I cannot ethically disclose this data to the public since it would be a breach of confidential health information and Health New Zealand has refused to respond to any of my requests to discuss this data with them so they can explain to me how I got it wrong.
The public should be outraged that they are ignoring this damaging public health data.
New Zealanders know what is going on from their own personal observations; this analysis merely confirms those observations
New Zealanders have experienced first-hand the sudden and unexpected losses of their friends and family at an unprecedented rate since the vaccines rolled out.
This analysis of the HNZ data is simply confirmation of what New Zealanders already know. It shows that if HNZ was concerned about people’s health, they had the data in their possession; all they had to do was look.
Thank you to Barry Young and Jordan Ash
We’d never have known about any of this if former Health New Zealand employee Barry Young hadn’t exposed the public health data for analysis.
Thank you to Jordan Ash for suggesting I look at the gender mortality disparities.
You can now follow Barry Young on X
Please give Barry a follow on X. I was his first follower.
This will be important as a way for him to keep you informed about what is going on with his case. He has close to 2,000 followers right now.
He probably should list his occupation as “ethical Oracle database administrator.” He’s looking for a job and can work remotely. He’s an expert Oracle 11 DBA. Contact him on X after he makes his first post. I’m going to have him open up for DMs as well.
Summary
I showed two things here:
- Earlier shots have a larger gender disparity than later shots. So death rates are dose dependent which is a sure sign of causality. This is a relatively small effect, but it is statistically significant and has never been acknowledged by authorities.
- I showed once again that when mortality falls in New Zealand, if you get the shot, your mortality can defy the downward trend and shoot up.
The silence from Health New Zealand on their own data is stunning. They do not want to talk about the data at all. This is because properly analyzing the data subjects them to criminal negligence in the deaths of thousands of New Zealanders.
The willful blindness needs to stop. The public needs to hold them accountable by demanding they examine their own data and make the full obfuscated records public just like I did. No one’s privacy was breached. They should also allow scientists to question their epidemiologists on their analysis.
We need full public transparency of the public’s health data in New Zealand. And we need it now. Otherwise, an innocent man will go to prison for 7 years.
